
A series of photographs taken using a bracketed exposure can be combined into a high dynamic range image. Each pixel encodes the value of the luminance that hits the camera’s lens or “eye”. Using software to decode the luminance values can identify the brightest spots in the visual field. These spots often represent potential glare or unshielded light sources. To obtain accurate measurements it is important to use a fish-eye lens to capture the vertical luminance in the image. It is possible to do a glare analysis on an hdr image produced with a standard lens however the luminance mapping may not be as accurate.
| Likelihood of Glare | DGP | DGI |
|---|---|---|
| Imperceptible Glare | < .35 | <18 |
| Perceptible Glare | .35 - .40 | 18 - 24 |
| Disturbing Glare | .40 - .45 | 24 - 31 |
| Intolerable Glare | >.45 | >31 |
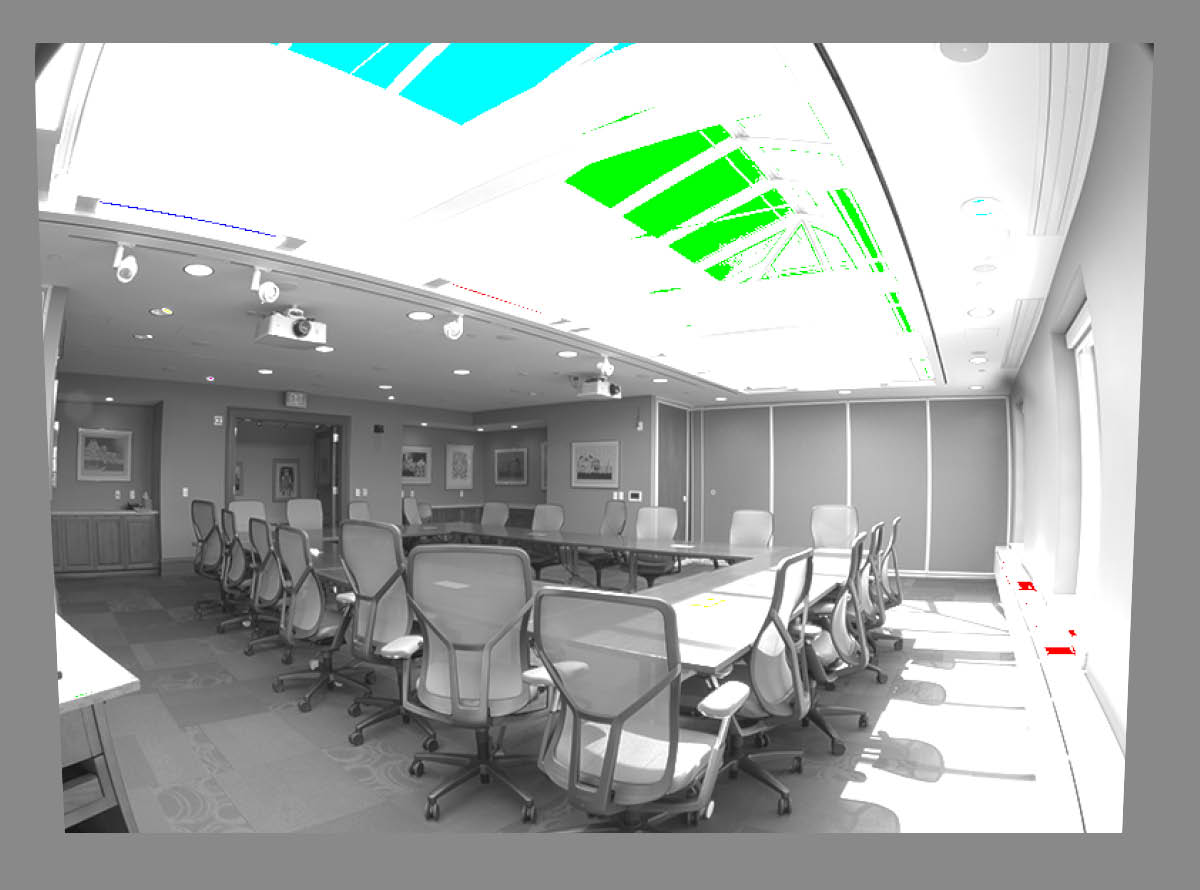
A Glare Index uses these luminance values to calculate the probability of glare sensations in user viewing the scene. The most common glare indices are: Daylight Glare Probability (DGP) and Daylight Glare Index (DGI). These measure the contrast ratio of luminance values in the field. The results of the calculations fall into four categories representing the likelihood of glare. Glare analysis can be done using the Radiance and Evalglare software programs. HDR Scope provides a user interface for applying these programs to HDR photos. Other programs such as Revit or AGI32 can apply glare analysis to computer modelled spaces to identify glare before a space is built.
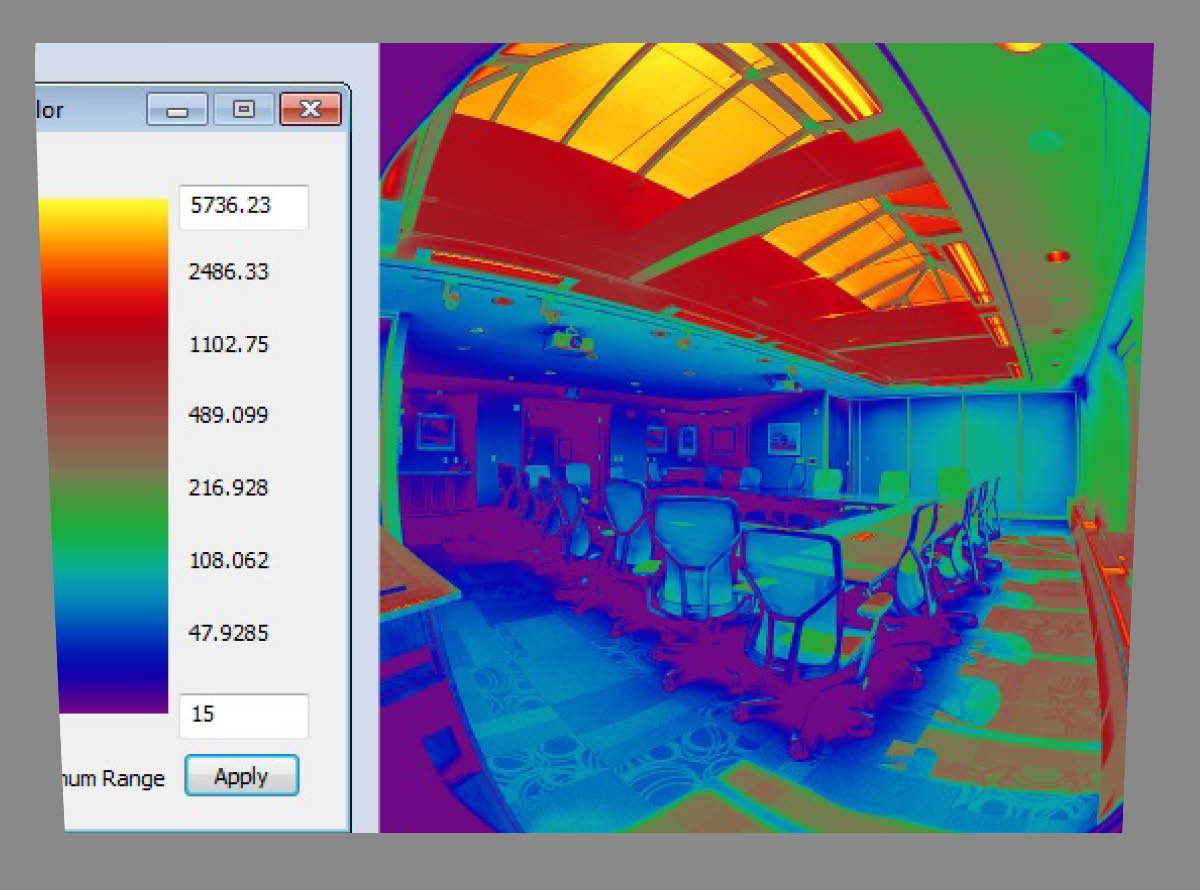
Luminance Mapping is a way to analyze the visual scene using photography. A series of photographs taken using a bracketed exposure can be combined into a high dynamic range image. Each pixel encodes the value of the luminance that hits the camera’s lens or “eye”. Using software to decode the luminance values and translate the image to a false color view helps identify the brightest spots in the visual field. These spots often represent potential glare or unshielded light sources.
Photoshere, HDR Scope and WebHDR are popular programs to analyze these images. They are user interfaces based on the Radiance software created by Greg Ward and commonly used to analyze daylight in computer rendering software. Photoshere is Mac based and can both create the HDR and analyze it. HDR Scope is windows based and does not create the HDR image but can create false color images and provide glare analysis using the EvalGlare script. WebHDR is a web-based user interface for Radiance that can create HDR images and produce false color luminance maps. Each of these programs has limitations of file size because of the complicated calculations required. Commercially available apps can also illustrate luminance values in the visual field using a smart phone with a camera.
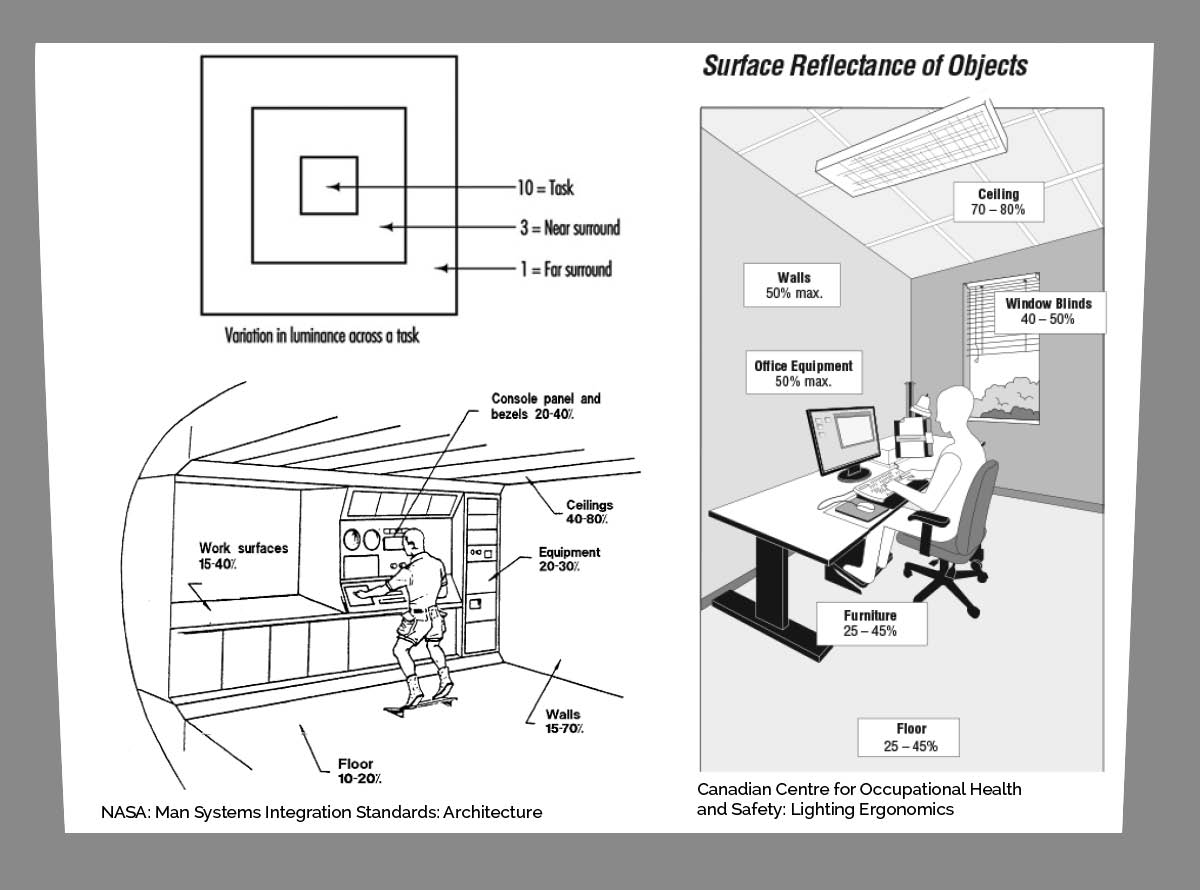
Value Contrast is recommended both in ratio between the task and its surroundings or in the Light Reflectance Value (LRV) of the material. LRV is how much light a color absorbs or reflects. This is sometimes also called a luminance factor. The LRV is commonly listed on paint samples and some material specifications.
The graphic on the near right shows recommended ratios between value of the task and the background to provide best visibility.
For best lighting conditions, ceilings are kept at a high luminance factor to reflect light diffusely throughout the room. Floors should have a relatively low light reflectance value to avoid specular reflection or glare back towards the eye.
Even NASA has recommended LRV values for its space shuttle controls and environment!
Evaluating the visual environment is a multi-step process. It begins with conducting a visual audit of the space, identifying key destinations, common paths of travel, and documenting physical measurements and light values within the space. This should include measurements taken with light meters as well as photographic documentation for further glare analysis.
After documentation, interviews with users should be conducted to identify known issues with the existing space or perceived need for renovation. When all programming information has been collected, the design problems can be compared to the low vision typologies to see where there may be specific visual problems that should be addressed.
Using this process a regional vision clinic was evaluated as an example. By identifying the low vision typologies that existed in this space is was possible to create a design proposal for the client to improve the environment of the clinic for its visually impaired users. This initial design analysis suggested that signage, light distribution, and luminance glare might be problems in this space.
![]()
Initial Wayfinding signage at building entrance is low contrast and not repeated at eye level.
![]()
Signage throughout the building is “beige on beige”. While this color scheme coordinates with the wall finishes and may meet contrast requirements, the similar hues make letters indistinguishable as shown in the false color image.
![]()
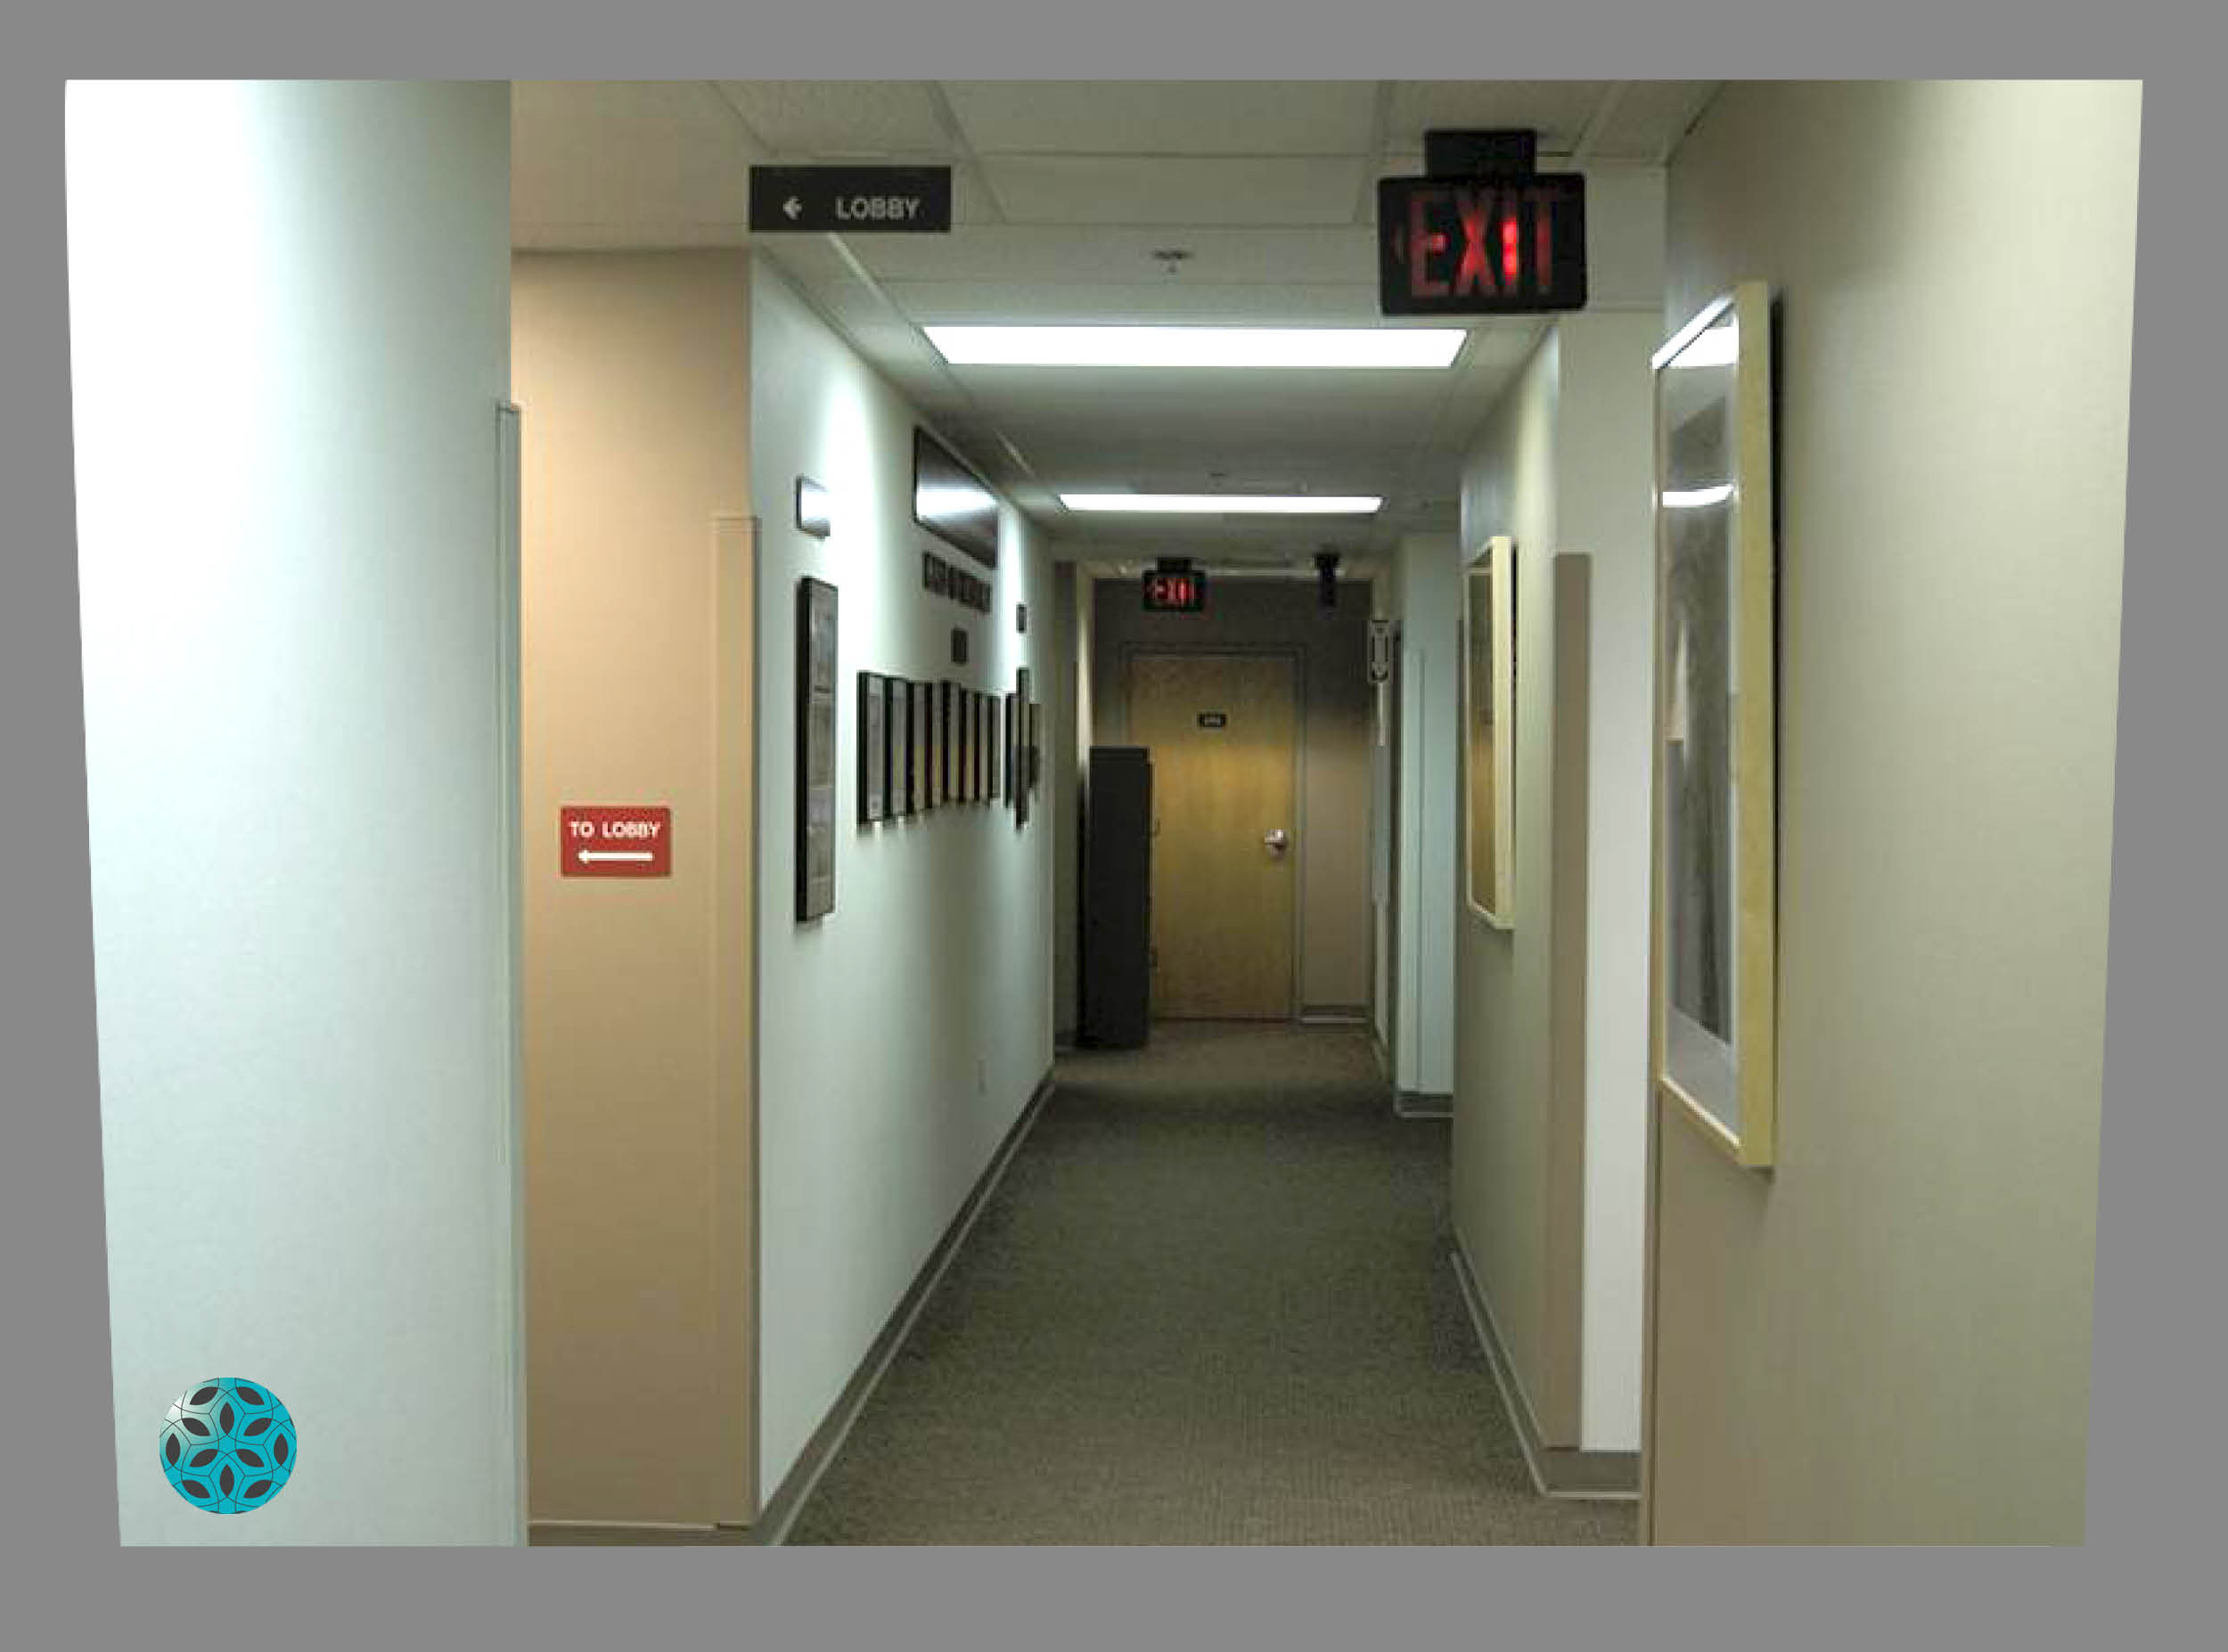
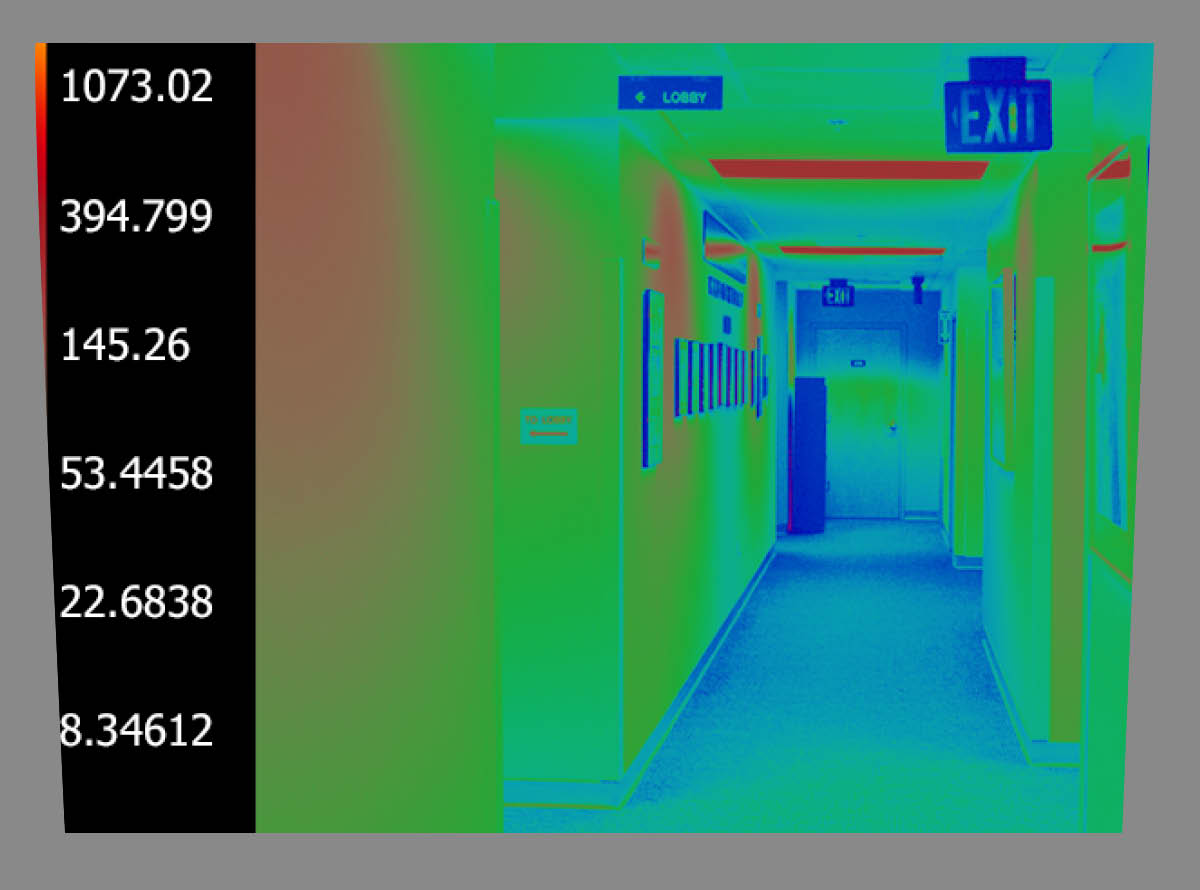
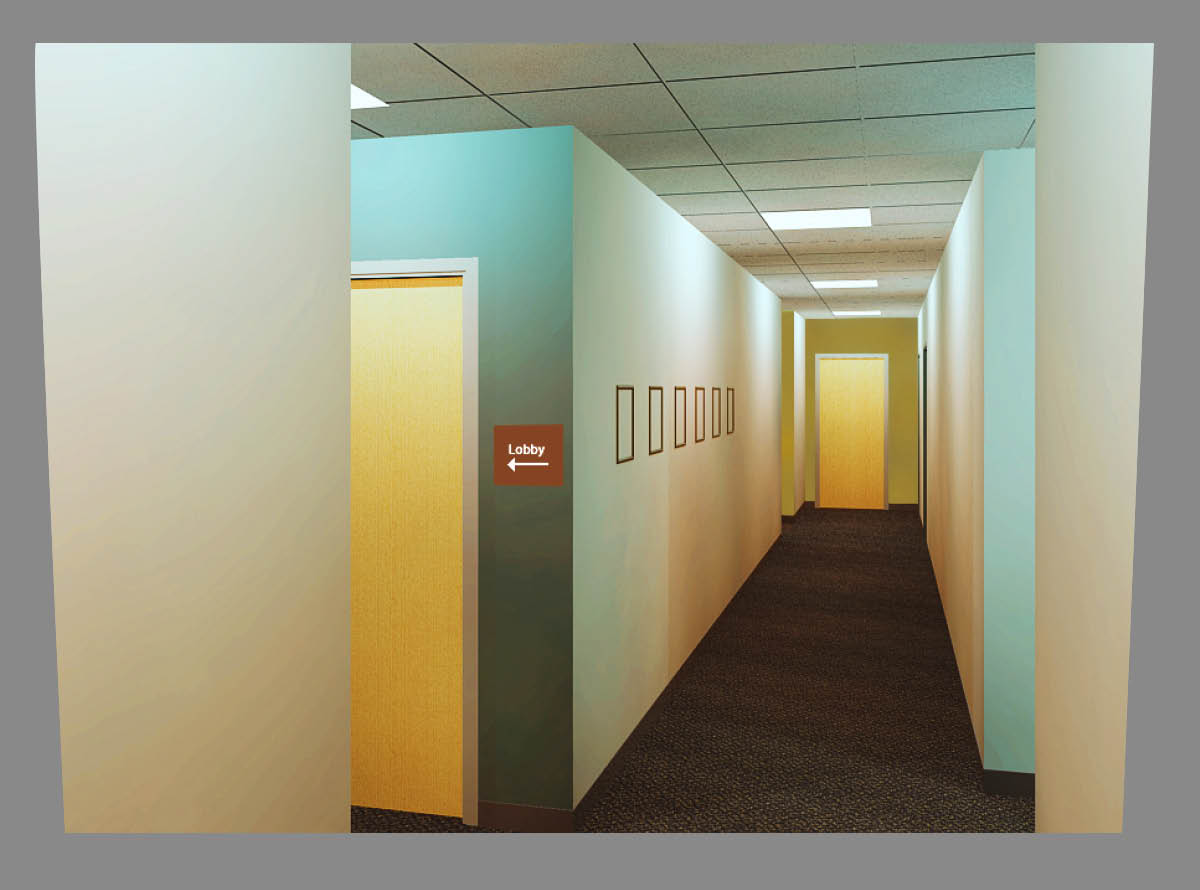
Hallway lighting creates strong contrast between light and shadow. There is no delineation of architectural features.
![]()
The false color view shows the luminance contrast caused by uneven lighting in this hallway. The lighting plan for this floor should be re-evaluated by a designer.
Luminance values in these images range from around 10 fc/m2 to about 600 fc/m2 from the diffuser on the light source.
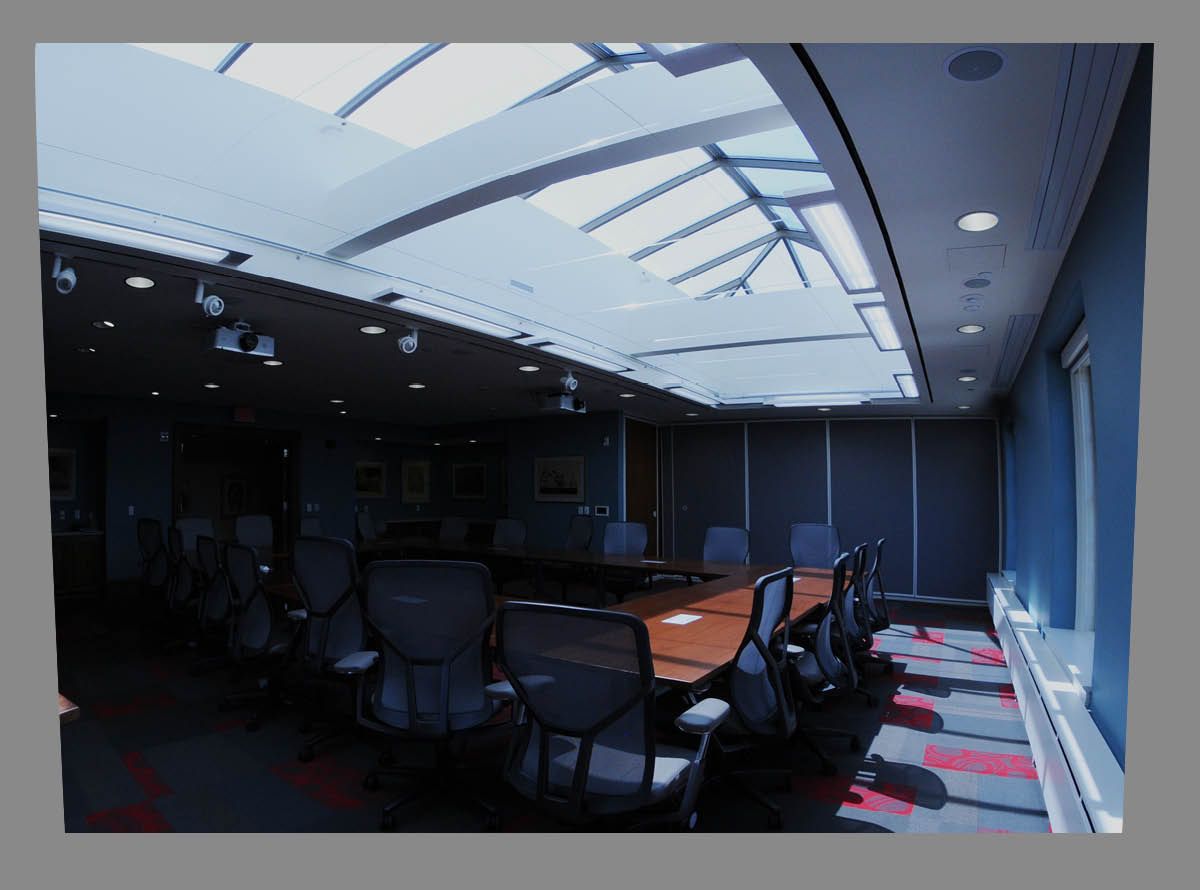
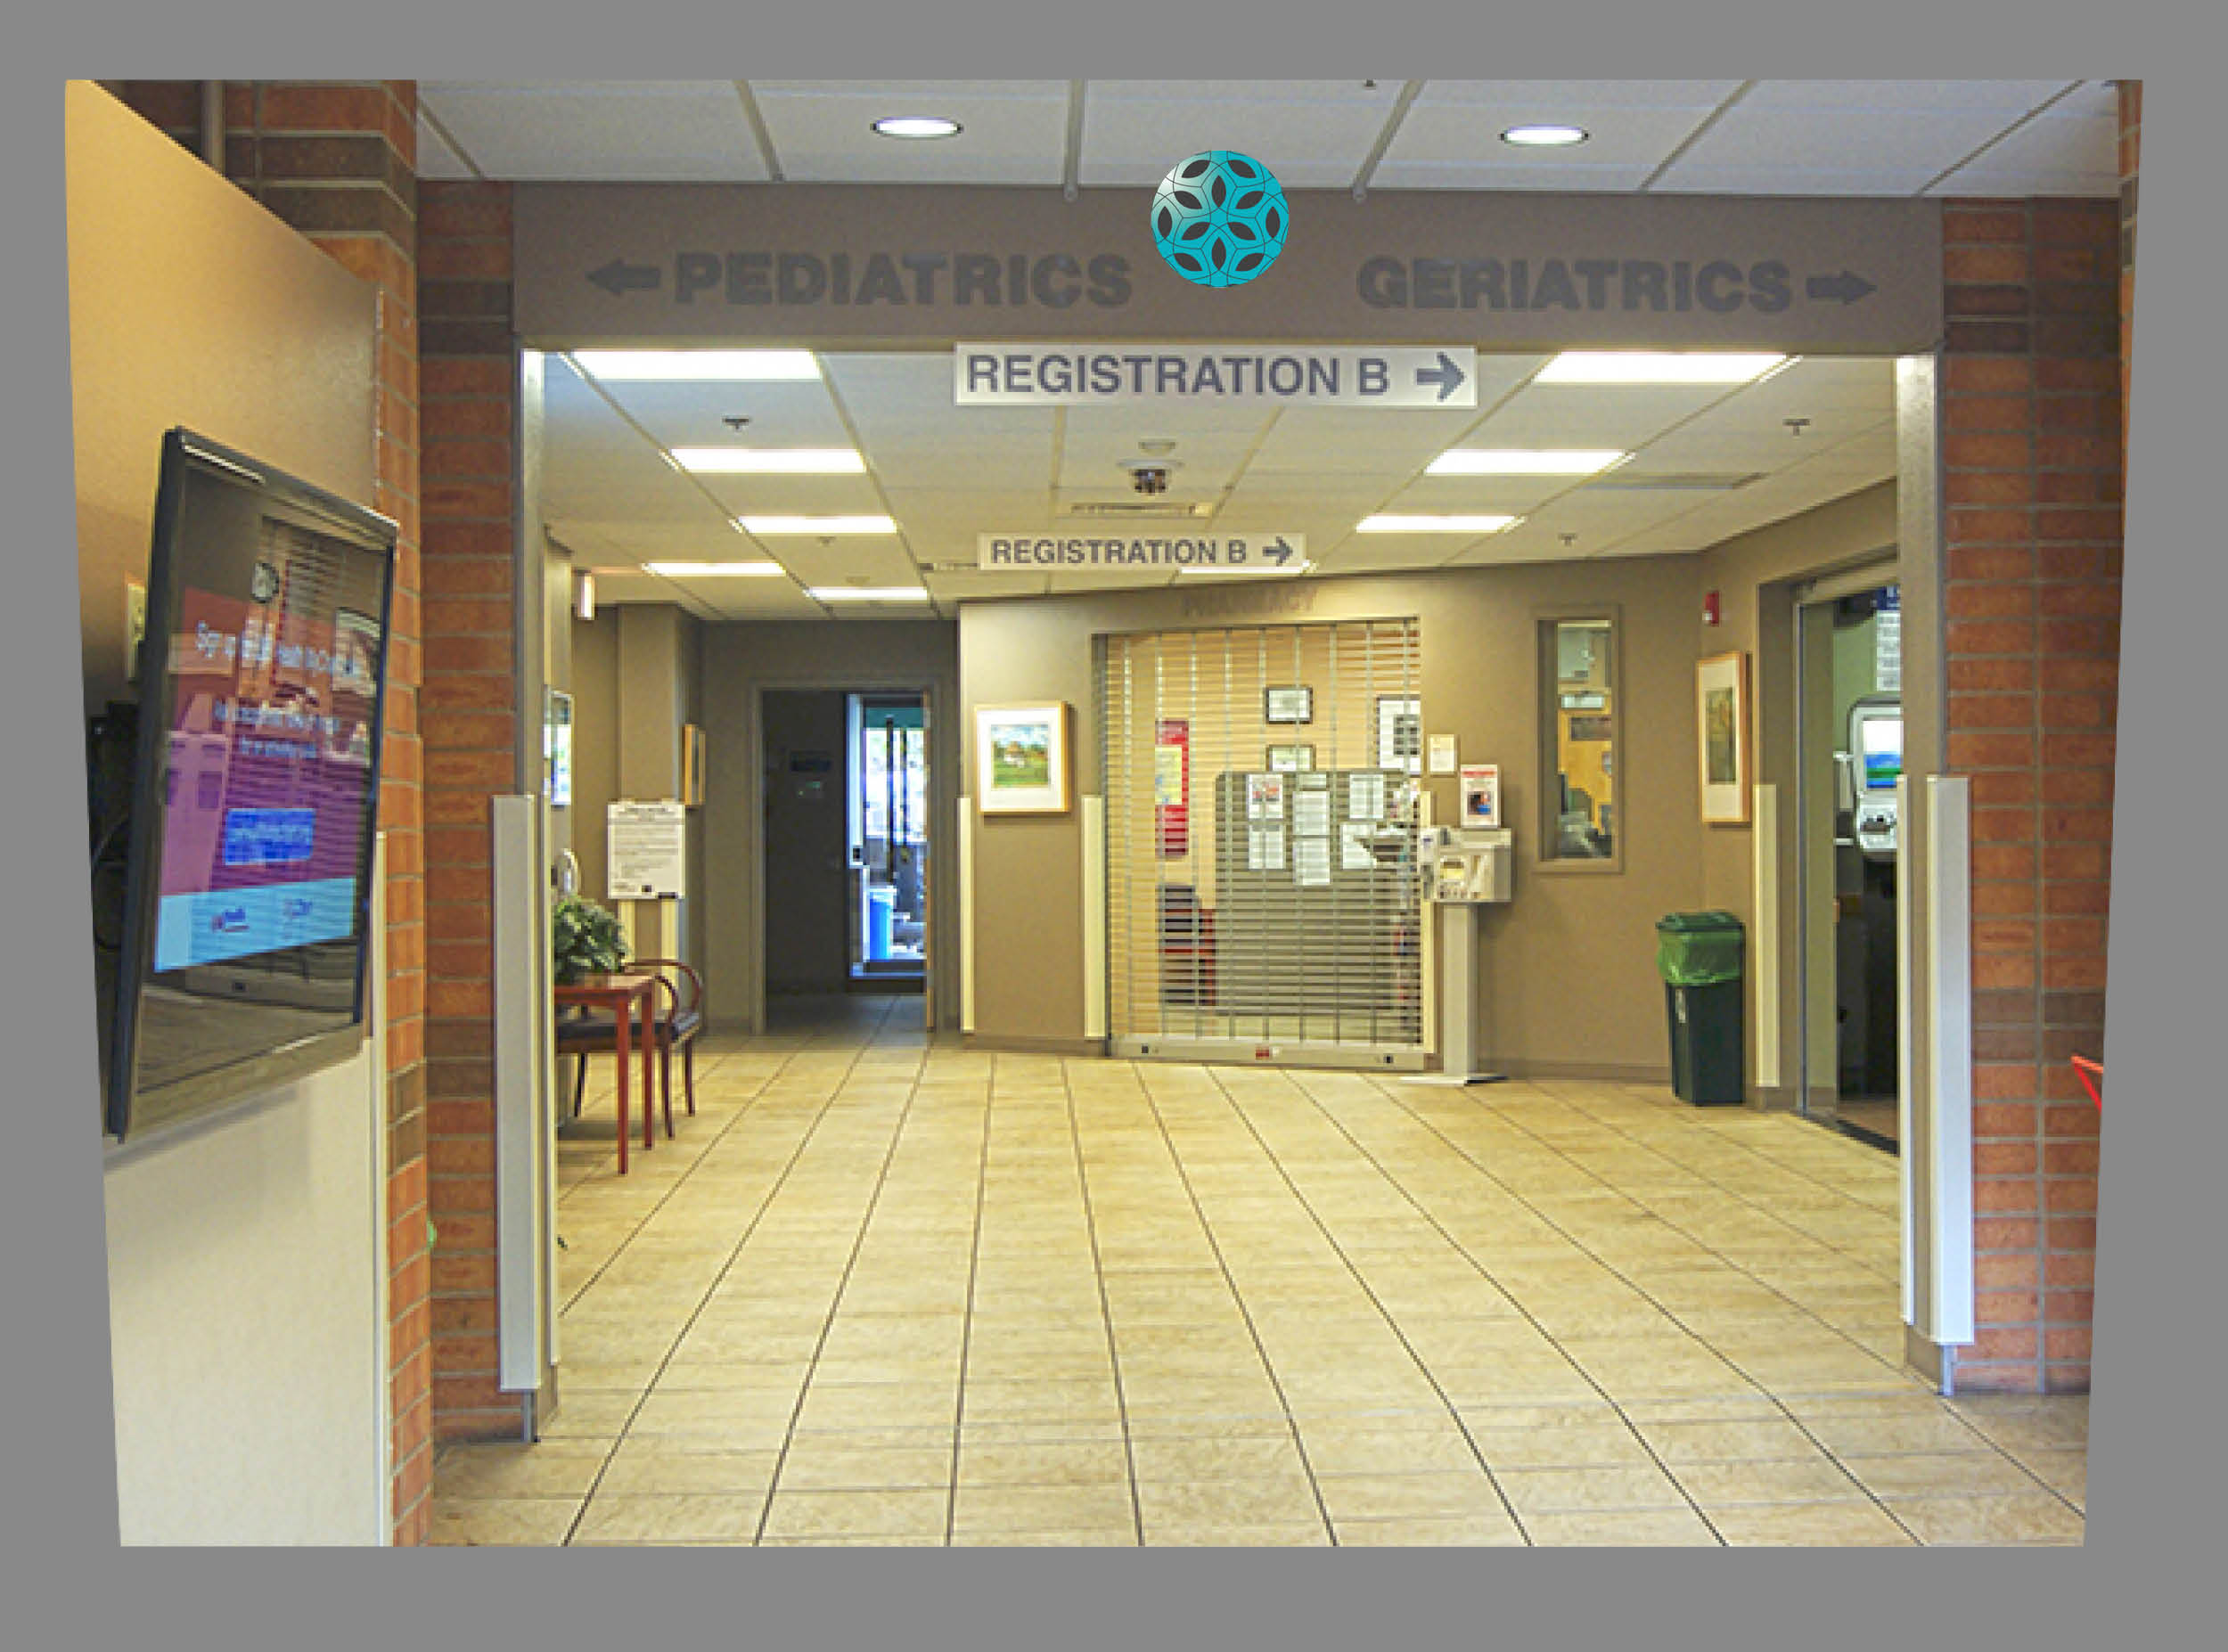
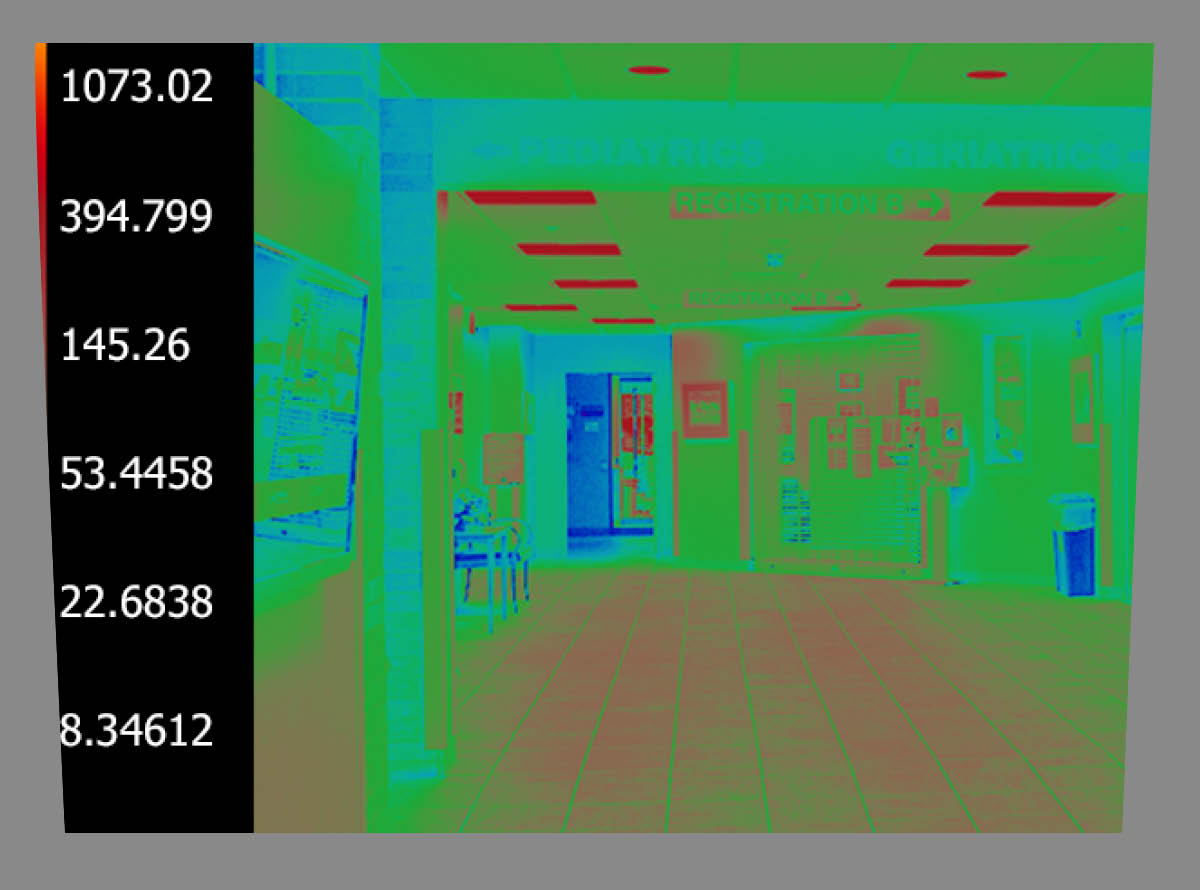
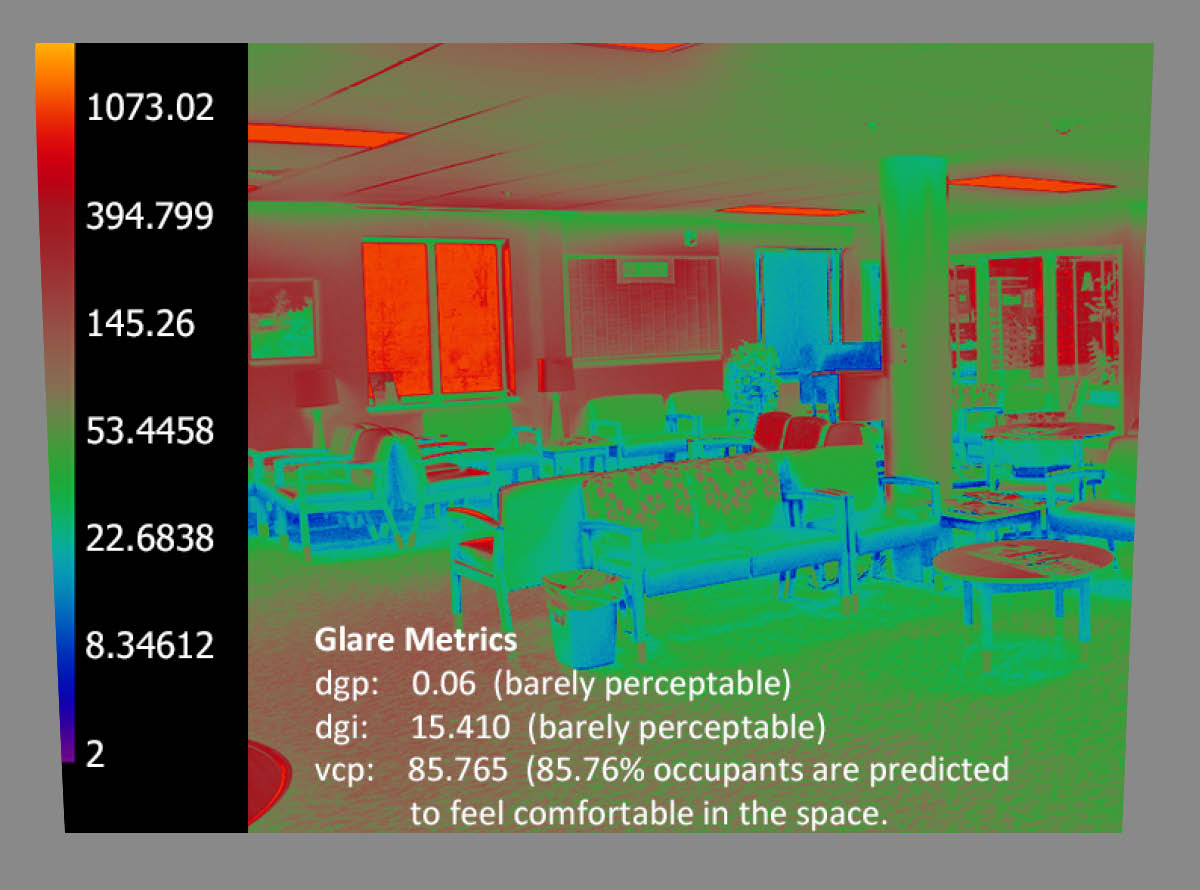
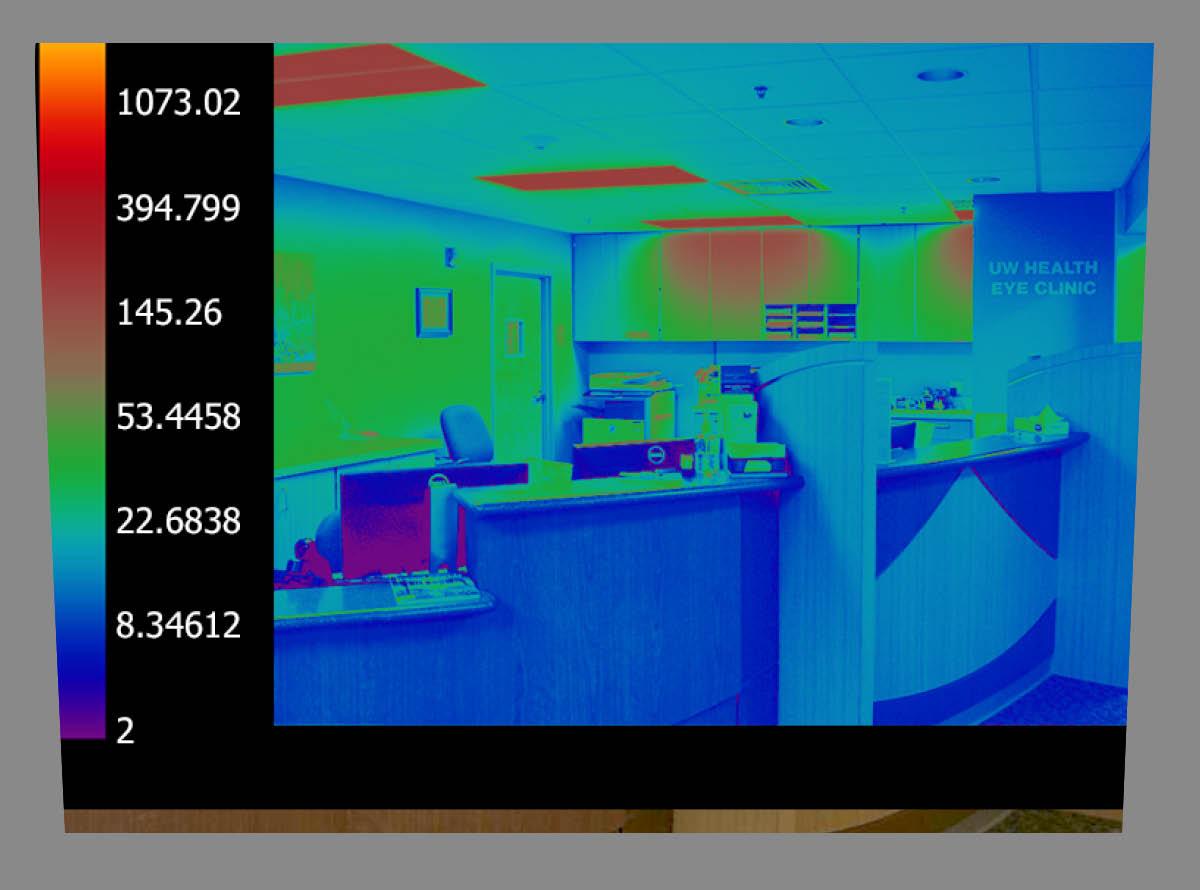
Using false color images and glare analysis we can compare four different scenes. The false color scale uses color to show the luminance range in the view. The brightest yellows are 3000 candelas/meter squared (cd/m2) or greater. The deepest purples are 2 cd/m2 or less. The results of the glare analysis for this lobby space were calculated using the EvalGlare script inside HDRscope software. Click here for more on Glare Indices and Luminance Mapping.
![]()
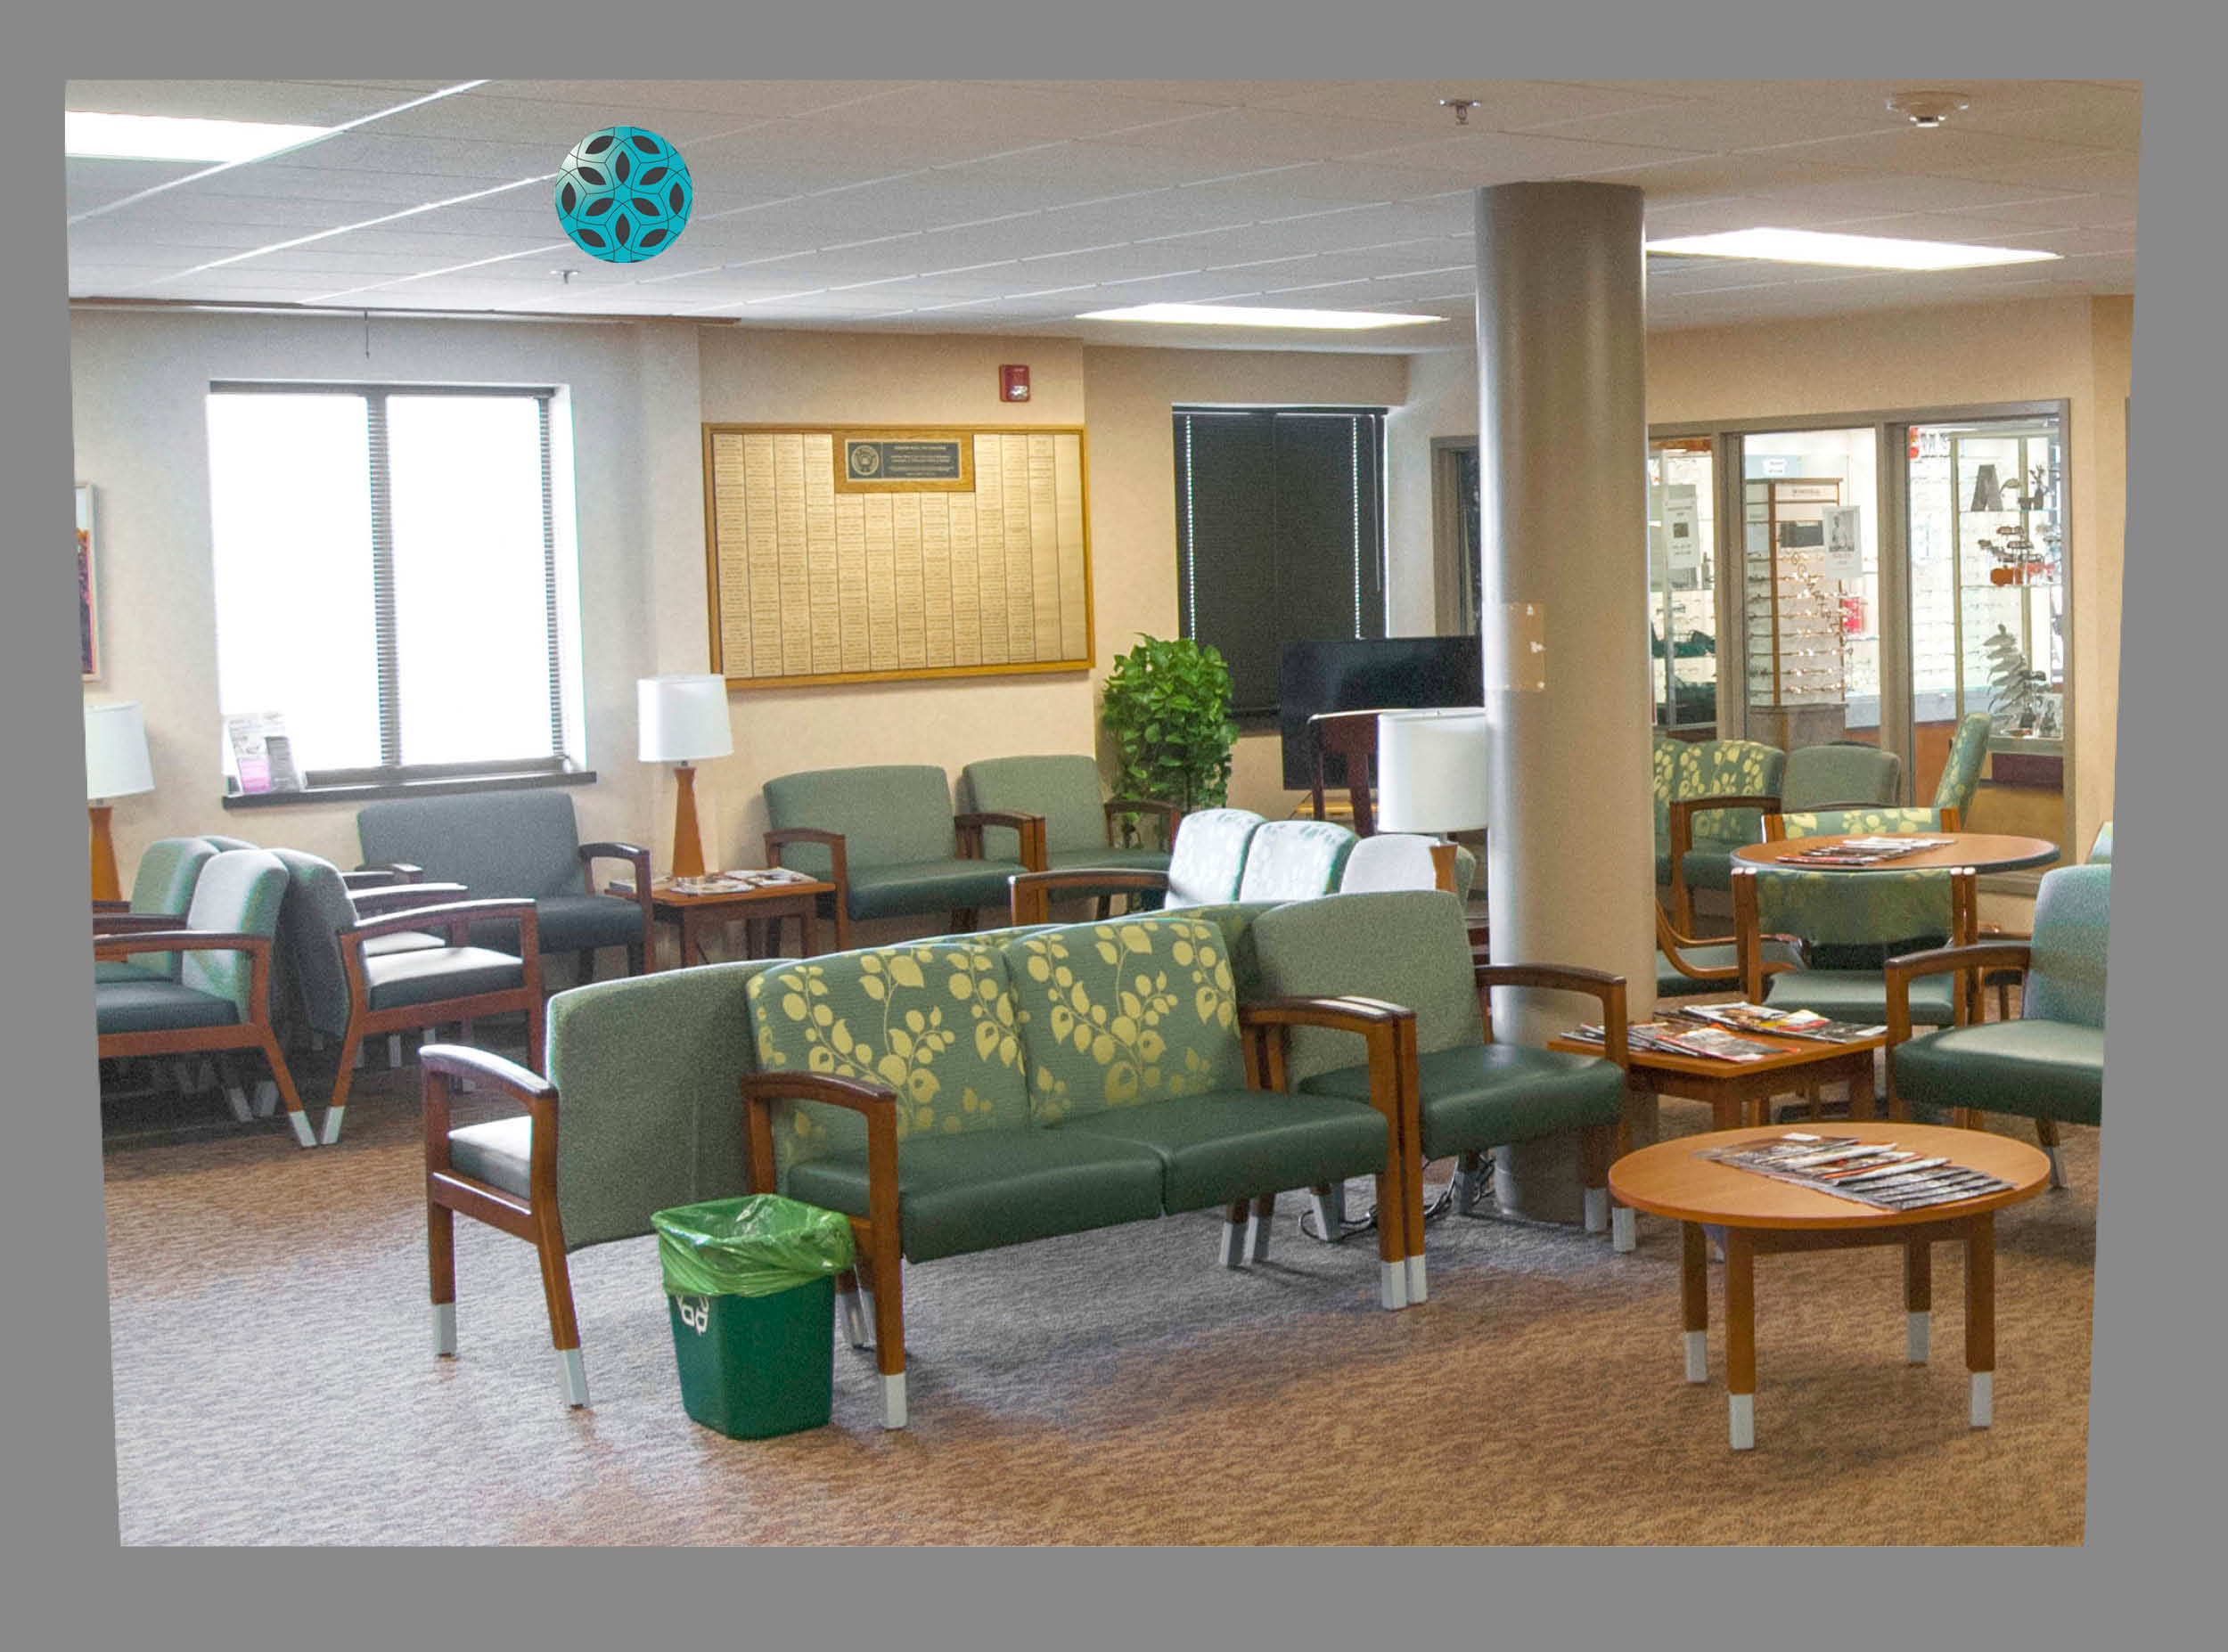
Bright light from the window may cause glare. Retail shop, and pediatrics waiting draws patients away from the desk.
![]()
The glare analysis of this photo suggests that the high luminance from this window is not enough to cause glare. However, because of its placement across from the elevators, the window shade should always be angled to reduce direct light. It is also a low light space making the perception of bright areas more noticeable.
![]()
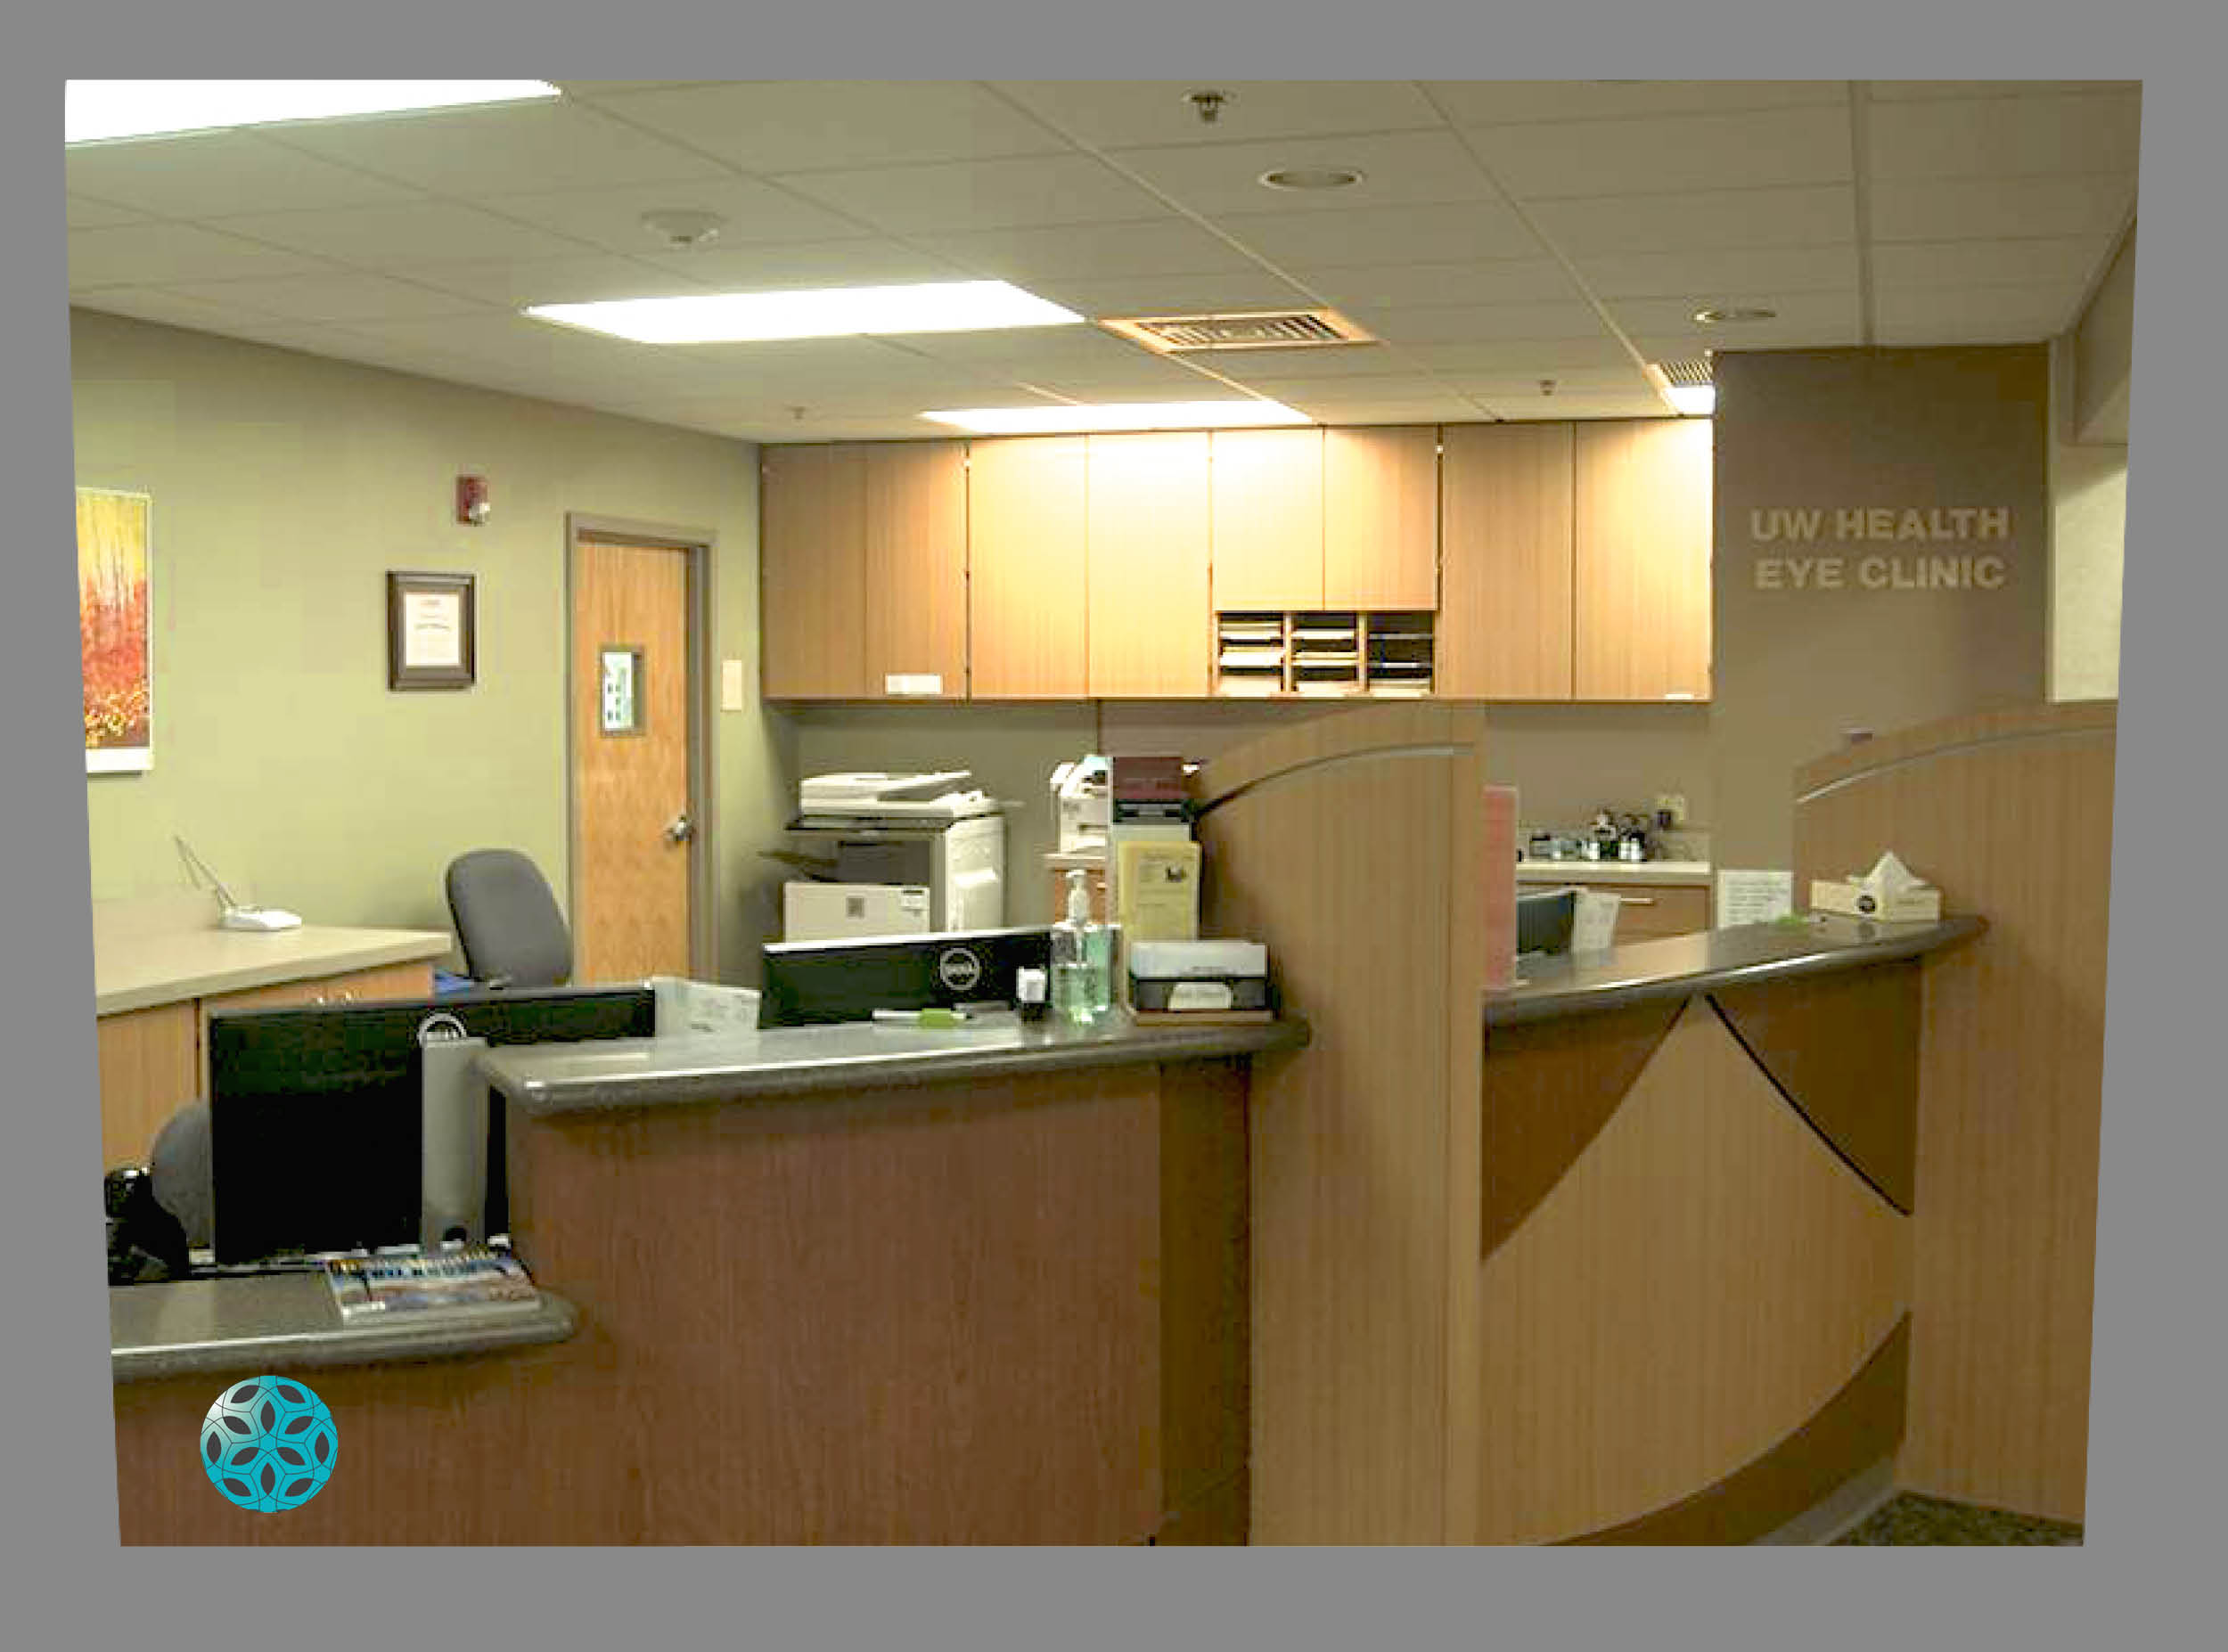
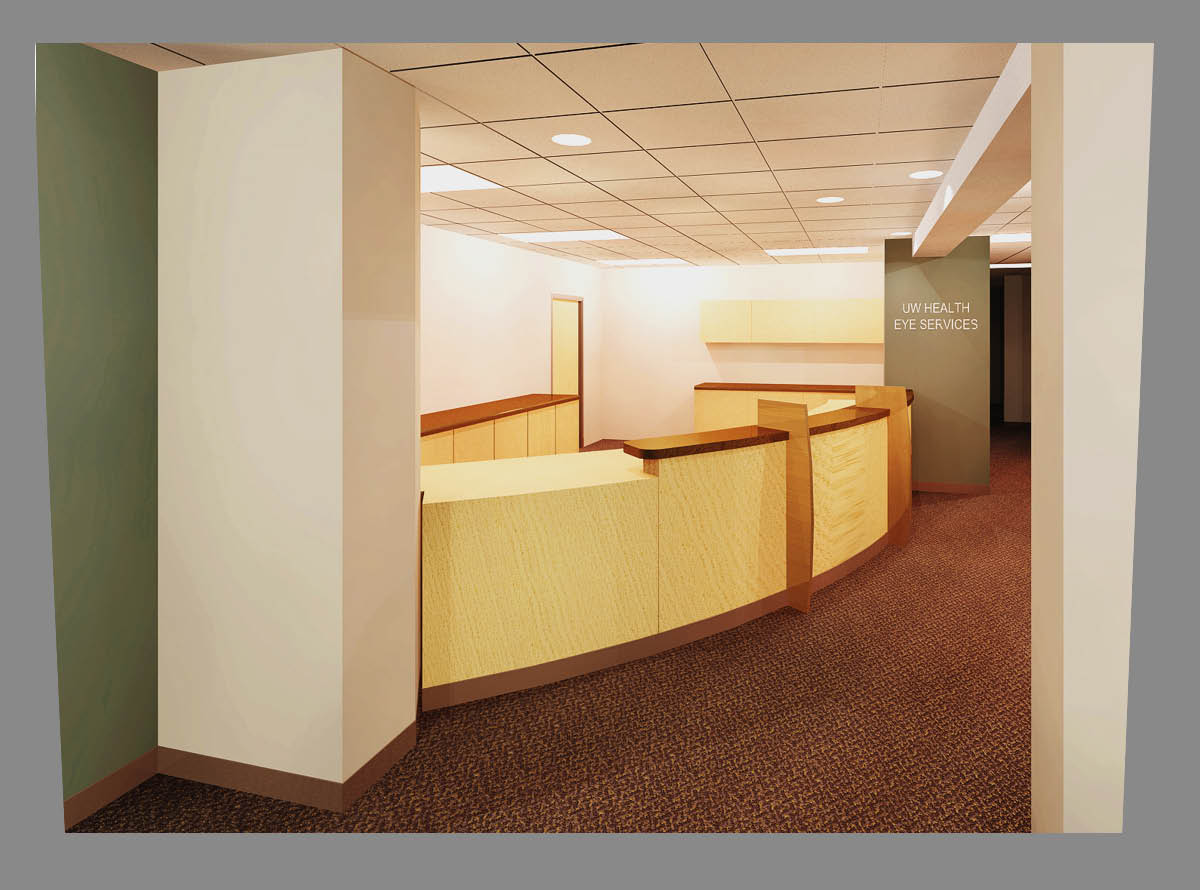
Disabled lighting at reception and out of the way location help this desk blend with the surroundings.
![]()
It is difficult to distinguish the transaction surface from the rest of the desk and to identify if there are staff seated behind the partition. The off center location of the desk and low lighting may make it uncomfortable for patients to approach this desk. Identification signage does not adequately contrast with the background.
After photographing the space and analyzing based on initial impressions and knowledge of the design typologies it is important to interview the users. For confidentiality reasons, no patients were interviewed. However, fifteen staff members asked to identify problems they see in the built environment, or areas where they see patients struggling to effectively navigate or use the clinic spaces. Staff members were interviewed separately and common responses are highlighted in bold. The analysis description is as shown below with major design goals identified for each category.
Improve ambient light levels, provide suitable lighting controls and use accent and task lighting to create levels of light. Recent lighting upgrades put higher efficient lamps into existing fixtures but did not re-evaluate the layout of fixtures. Higher light levels at the reception desk and other architectural nodes will help distinguish them as wayfinding components.
Create a building signage plan that improves contrast, size, and sign location. Improve finish contrast throughout to help patients identify destinations and obstacles by adding accent finishes in hallways, contrast handrails and corner guards at nodes and contrast door frame and base color to delineate walls and doors. Consider consistent dress code for staff such as medical scrubs to easily identify employees.
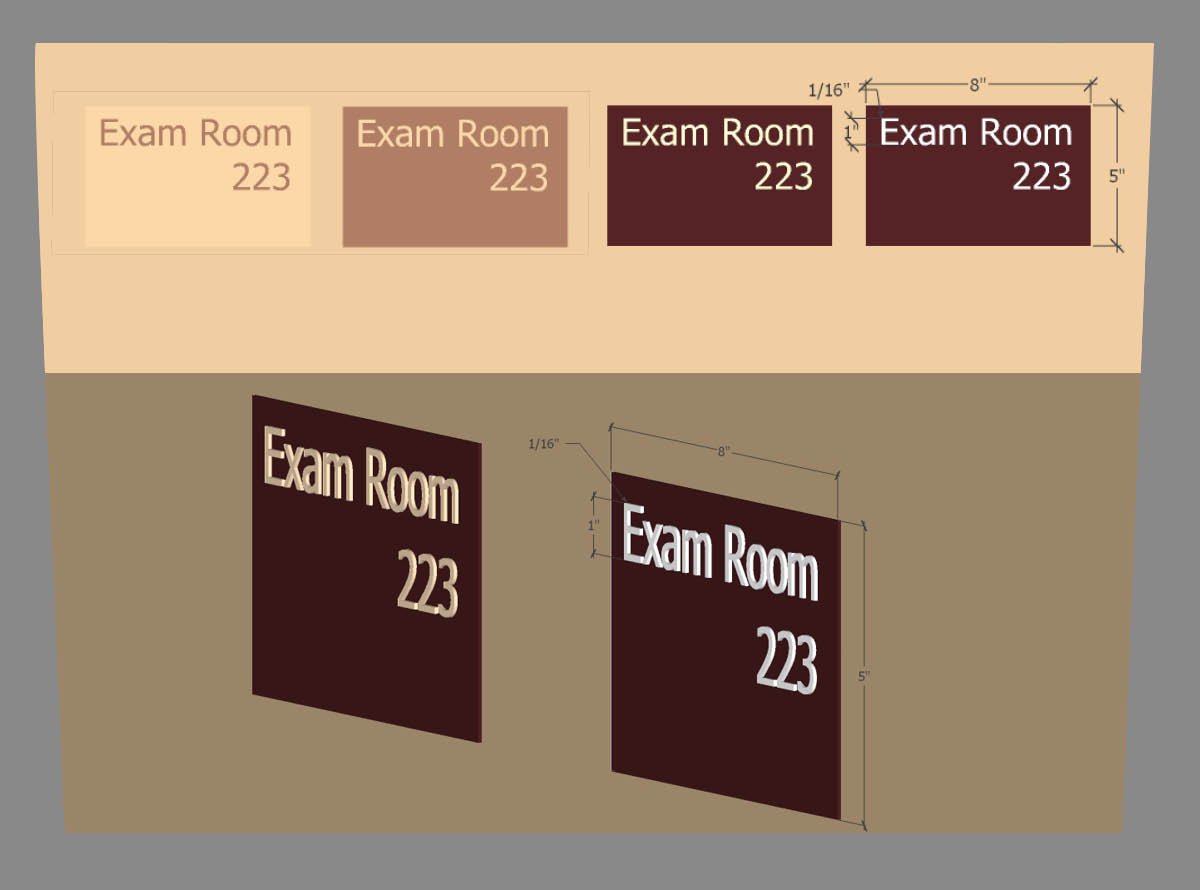
These signs show how monochromatic color schemes make it difficult to find the sign on the wall. White text in a larger 1” size is easier to read than beige even if they both meet the Light Reflectance Value (LRV) contrast requirements for signs of 70% between text and back.
These signs show how monochromatic color schemes make it difficult to find the sign on the wall. White text in a larger 1” size is easier to read than beige even if they both meet the Light Reflectance Value (LRV) contrast requirements for signs of 70% between text and back.
Consider lighting needs of individual tasks and locations. Create a dim lounge for dilated patients and accent lighting to direct others through the space. Task lighting at exam room surfaces and to direct patients to the exam chair could be beneficial.
Updating the light fixtures, using higher contrast signs and accent wall colors can add wayfinding features and improve ability to navigate comfortably.
Improve wayfinding through signage. Improve overall accessibility with doorways, room sizes, bathrooms, furniture layouts and floor plan. This will mean adequate space planning and providing larger space allowances in exam rooms and lobby areas than typical called for in clinic spaces.
Where it started. “A validated lighting simulation tool” and the basis of most digital lighting analysis software. Unfortunately, it is a command line program so I recommend using one of the user-friendly interface software programs below.
Great program. Combine HDR images and calibrate the pixel luminance values from measurements taken with an external luminance spot meter. Mac-only software. Save file as Radiance HDR format and use with HDRscope for glare analysis.
Used to create false color luminance maps, apply tonemapping, and glare analysis by providing a simple user interface for the EvalGlare and Radiance software programs. Only opens HDR format photos.
Web based HDR creation software. Another good overview of HDR and simple to use. Images uploaded must be less than 12MB total. The program creates the HDR image, and an interactive false color luminance map. Low tech and reliable.
This is a great tutorial for making HDR images in photoshop with a good review of HDR images. Photoshop can create HDR images, but does not maintain the luminance value of the pixels accurately. It is best used to crop and re-size the low dynamic range images before combining to HDR with another software. EvalGlare software requires that HDR images be no larger than 800 x 800 pixels. Use “canvas size” to crop the images consistently, and “image size” to reduce the resolution and pixel value before using a different software to combine the images to HDR.
Illuminating Engineering Society: www.ies.org and the IESNA Lighting Handbook
ANSI/IES RP-28-16 (New Edition!): Lighting and the Visual Environment for Senior Living
National Federation of the Blind: nfb.org
Lighthouse International: www.lighthouse.org
National Institute of Building Sciences: Low Vision Design Committee www.nibs.org/lvdc
CIE conference on Lighting Quality & Energy Efficiency April 2014- List of Abstracts: malaysia2014.cie.co.at/programme
Canadian Centre for Occupational Health and Safety: www.ccohs.ca/oshanswers/ergonomics/lighting_survey.html
Low Vision Design Committee: www.nibs.org/lvdc